
Daily Gold Analysis for a concise look at current price action
Follow Daily Gold Analysis for timely coverage of gold prices, market momentum, and the forces influencing today's precious metals market.
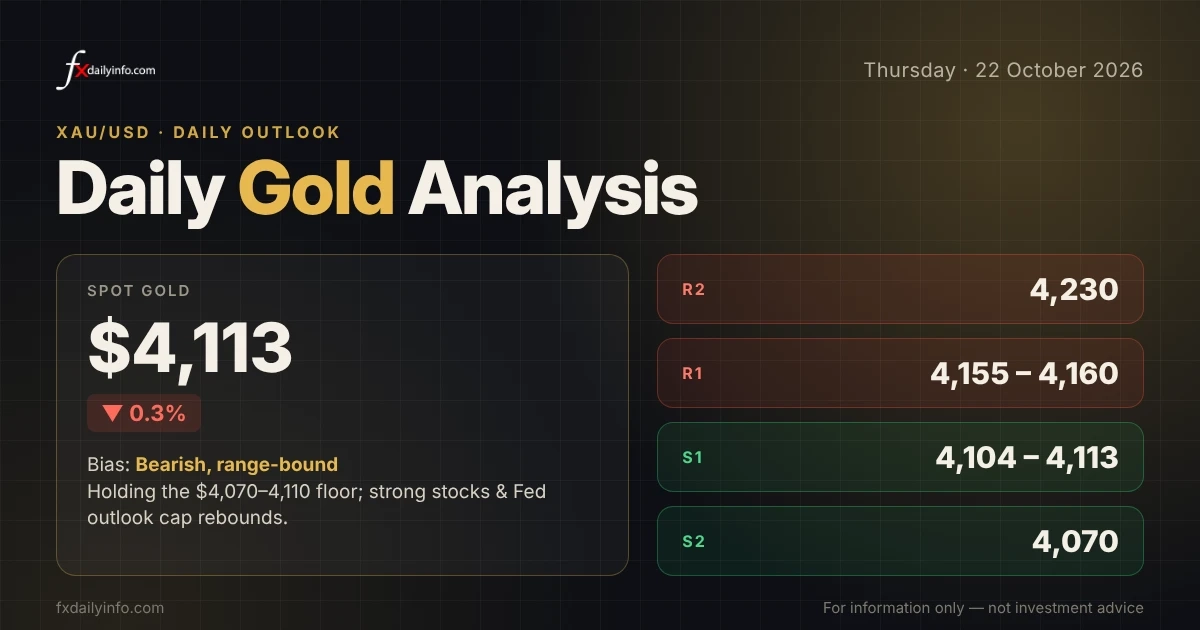
Direct link: Daily Gold Analysis for a concise look at current price action
Welcome to your Thursday, October 22, 2026, Daily Gold Trading Report.
Daily Gold Analysis : Live spot (Thursday morning): about $4,111, down from the ~$4,139 area overnight after three failed probes of $4,141. Bias: Bearish, the ceiling held and the slide is intact.
Markets are open this Thursday. All prices are spot gold (XAU/USD) unless labeled otherwise. Momentum reads are structural this morning: TradingView's live chart stream would not load on this network, so the charts below are rendered from real Kraken PAXG/USD market data (PAX Gold tracks spot gold 1:1) with the source disclosed in-image, and the momentum read comes from that same data rather than from TradingView's indicators.
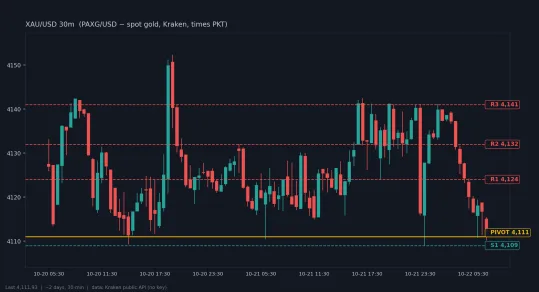
Charts: TradingView capture was attempted first this morning (the widget embed and the standard chart page) but the chart data never streamed on this network, so both charts are rendered locally from Kraken's public PAXG/USD feed, which tracks spot gold 1:1, with the source disclosed in each image. The day's levels are drawn on each chart's own price axis. R3, R2, R1, PIVOT, and S1 fall inside both charts' visible ranges; S2 and S3 sit below the visible range and are not marked.
1. Key Technical Levels
2. Trading Bias: Bearish, ceiling held three times
The trading bias is Bearish on the morning tape. Overnight gold knocked on the $4,141 ceiling three times, on the 20:00, 23:00, and 01:00 hourly bars, and each probe was sold back down with long upper wicks. That is about as clear a rejection signature as the intraday tape prints. What followed was a steady $30 slide into this morning, with price now sitting at about $4,111, right on the session low near $4,109. Sellers defended every lower high on the way down, and no bounce has yet held above $4,124, so the path of least resistance stays down while the ceiling holds.
The candlestick structure on the 1H and 30-minute charts shows lower highs and lower lows from the $4,141 rejection zone, and price sits below both the 20-hour and 50-hour moving averages on both timeframes, with the 20-hour average (about $4,126) running under the 50-hour (about $4,129), a clean bearish stack. Momentum is softening rather than washed out: RSI has drifted into the mid-30s, weak but not oversold, which means there is room for the slide to extend before dip-buyers get aggressive. The 00:00 bar's dip to $4,109 and the immediate wobble around $4,111 tell you the market is testing demand at the session low right now; until buyers print a higher low, rallies are corrective.
The line in the sand is $4,124. An hourly close above $4,124 turns the bias Neutral and opens a test of $4,132, then the $4,141 ceiling. An hourly close below $4,109 breaks the session low and turns the slide into a trend day, targeting $4,100 first and the $4,073 range floor after that. Until one of those prints, rallies toward $4,124 are the short side's entry and the $4,109 low is the market's honesty test.
Daily Gold Analysis: Annotated Charts - XAU/USD, this morning
1H - ~5 days, levels R3 to S1 (S2, S3 below visible range)

30m - ~2 days, levels R3 to S1 (S2, S3 below visible range)
3. Macro & Geopolitical Analysis
The Federal Reserve stays in its pre-meeting blackout ahead of the October 27 to 28 FOMC meeting, so the market trades data and headlines alone this week. After Chair Kevin Warsh declined to give rate guidance, October hike odds sit near 14 to 17%, while a December move stays priced near 89 to 94%. The September inflation double-hit keeps that December tightening option alive: CPI printed 3.7% year on year against 3.6% expected, and PPI surged 6.3%. The 10-year Treasury yield holds in the 5.09% to 5.13% area this morning, off the 5.14% intraday spike, with the 30-year near 5.42% and the 2-year near 4.77%. Every point of that yield is a point against gold's zero-yield carry: the tape trades each print as a December-hawk vote, and that is the heaviest weight on price this morning.
The dollar index holds near 101.6, consolidating above its three-week low, and a firm dollar remains the single cleanest headwind gold faces. The greenback found extra safe-haven support after reports that the US State Department is preparing to pull some embassy personnel and families out of the Persian Gulf, a signal markets read as possible new US or Israeli strikes against Iran or the Houthis. Underneath, the structural bid has not gone away: central banks remain steady net accumulators, and Goldman Sachs now sees gold averaging toward $5,400 an ounce by 2027 on central-bank buying, which is why each slide has stayed orderly rather than turning into a break. Gold is caught between pressure from yields and the dollar, and support from fear, and this morning the pressure is still winning.
Crude is the live wire and it feeds gold through the inflation channel. Brent holds near $108 to $110 this morning after touching $111.99 overnight, a five-month high, while WTI sits near $98 to $99. The Strait of Hormuz risk premium is fully priced in: Iran's foreign minister says the Strait stays closed until Washington accepts Iran's conditions, Iran's first vice president says the country has no choice but to exercise sovereignty over the Strait, shiptrackers count at least 18 vessel attacks in two weeks, and the Houthis claimed strikes on Saudi Aramco sites in Yanbu and Shaybah plus Riyadh and Abha airports. Pakistan's army chief took a compromise proposal to Tehran, but Iran's security council chief told him the American demands are rejected, and Secretary of State Marco Rubio says a peace deal is extremely difficult, with the US-Iran conflict now in its eighth month. Against that, the Kremlin agreed a new round of US-Russia-Ukraine trilateral talks may happen in Abu Dhabi. For gold the net is two-sided: a fresh Hormuz incident re-bids oil and gold's haven premium together, but it also feeds the energy-to-CPI channel that keeps December hike bets pinned near 90%, which is exactly the weight on gold this morning. Goldman Sachs warns Brent could reach $140 in early 2027 if Gulf output stays 5 million barrels a day below February 2026 levels, against a base case near $90 by late 2026.
At home, the Karachi Sarafa board quotes 24K gold at Rs 435,400 per tola this morning (22K at Rs 399,100), about Rs 37,329 per gram and Rs 373,292 per 10 grams, carrying the usual local premium over the spot conversion. Roughly Rs 1,040 per tola moves for every $10 in spot at the current dollar rate near Rs 277: a reclaim of $4,124 would put local 24K near Rs 436,700 per tola, a break below $4,109 drags it toward roughly Rs 435,200, a test of $4,100 would price near Rs 434,300, and a run at the $4,073 range floor would print near Rs 431,500. Watch the Hormuz headlines before the spot print: oil news moves the board first, the metal second.
4. News of the Day & Impact Outcome
Recent News Outcome
Wednesday was choppy and heavy: spot gold bounced off the ~$4,106 low to about $4,133 to $4,139 in Asian and European trade, then gave it all back overnight as the $4,141 ceiling rejected three probes and price slid to ~$4,111 this morning, marking a fourth straight losing session on the week. Yields did gold a small favor, with the 10-year easing to the 5.09% to 5.13% area from the 5.14% spike, but the December tightening case stayed pinned near 90% odds and the dollar held near 101.6, so the metal could not hold its bounce. The Hormuz wire stayed live throughout: Iran said the Strait stays closed until the US accepts its conditions, vessel-attack counts hit 18 in two weeks, Houthi claims on Saudi energy sites kept Brent near $110, and the State Department's Gulf evacuation planning re-bid safe-haven demand for the dollar rather than gold. Kotak Neo's desk notes gold has held $4,070 to $4,220 since early October and warns a $4,000 test is on the table if oil extends its rally. Net outcome: the $4,141 rejection is confirmed as the week's ceiling, the yield-and-dollar pressure trade is intact, and gold is back defending the $4,109 session low with the tape trading the December-hike odds, not the Fed.
Upcoming Today
Today is about the yield, the dollar, and the headlines. The 10-year in the 5.09% to 5.13% band and the dollar near 101.6 are the two weights on gold: any extension of the bond selloff deepens the slide, while a yield fade hands the bounce its fuel. The Hormuz and Iran wire is the live catalyst: a fresh vessel strike or an escalation headline re-bids oil and gold's haven premium together, while steady de-escalation talk keeps crude heavy and gold's haven bid soft. The FOMC blackout runs all week into the October 27 to 28 meeting, so no Fed speakers to lean on. On the data calendar, weekly jobless claims and the University of Michigan consumer sentiment for October print today, where the inflation-expectations components matter as much as the headline for the December hike debate, with the PCE inflation print due next week.
Bullish Scenario
Yields fade from the 5.09% to 5.13% band, the dollar stalls near 101.6, and a Hormuz headline or a soft claims or sentiment print brings safe-haven and rate-rethink flows back to gold at once. Trigger: an hourly close above $4,124. Targets: $4,132, then the $4,141 ceiling. Catalyst: December hike odds cooling below 80%, or a fresh Strait incident that re-bids the war premium.
Bearish Scenario
The bond selloff extends, the dollar keeps firming near 101.6, and risk-on money keeps leaving safe havens while December hike odds stay pinned near 90%. Trigger: an hourly close below $4,109. Targets: $4,100, then the $4,073 range floor. Catalyst: a higher 10-year print plus firm US data through the week reasserts the tightening trade, and oil strength feeds the inflation case that weighs on gold.