
Stay current with the Daily Gold Trading Report for October 27
Stay current with the Daily Gold Trading Report for October 27, 2026, your Tuesday update on gold trading and the day's market activity.
Direct link: Stay current with the Daily Gold Trading Report for October 27
Welcome to your Tuesday, October 27, 2026, Daily Gold Trading Report.
1. Key Technical Levels (Expanded 9-Level Map)
Intraday levels derived from the 1-hour and 30-minute market structure, Tuesday's active Asian session range ($4,003.90 to $4,020.03), and the live spot baseline of $4,010.64 (-$6.56, -0.16% on the day), expanded to include R4 and S4 volatility boundaries in strict logical hierarchy:
2. Trading Bias
Intraday Bias: Bearish / Cautious Neutral.
Spot gold is attempting a corrective consolidation above the psychological $4,000 level after defending Friday's low ($3,975.88) during Monday's session. On Tuesday morning, XAU/USD reached an Asian session high of $4,020.03 before pulling back toward $4,010.64. While dip-buyers have successfully kept price above $4,003.90 (S1), the market structure remains a bear flag beneath the declining 50-period moving average on the 1-hour timeframe, indicating that broader distribution remains intact.
The 20-period EMA sits at approximately $4,008.00 on the 1-hour chart (now flattening beneath price), while the 50-period EMA continues to slope downward near $4,030.00. Reclaiming the 20-EMA has stabilized intraday momentum, but the 50-EMA and Friday's high at R2 ($4,034.04) represent heavy overhead resistance.
The 1-hour Relative Strength Index (RSI) has rebounded from oversold conditions to 48, reflecting equilibrium. The MACD histogram has printed mild bullish ticks near the zero line, but higher timeframe indicators (4-hour and Daily) remain rated 'Strong Sell'.
Immediate intraday structure is anchored at S1 ($4,003.90). A 15-minute close below $4,003.90 opens a rapid retest of S2 ($3,985.24) and S3 ($3,975.88). Conversely, a sustained 1-hour close above R1 ($4,020.03) targets R2 ($4,034.04), while breaking R3 ($4,048.00) firmly invalidates the bearish bias and opens room to R4 ($4,065.00).
1H
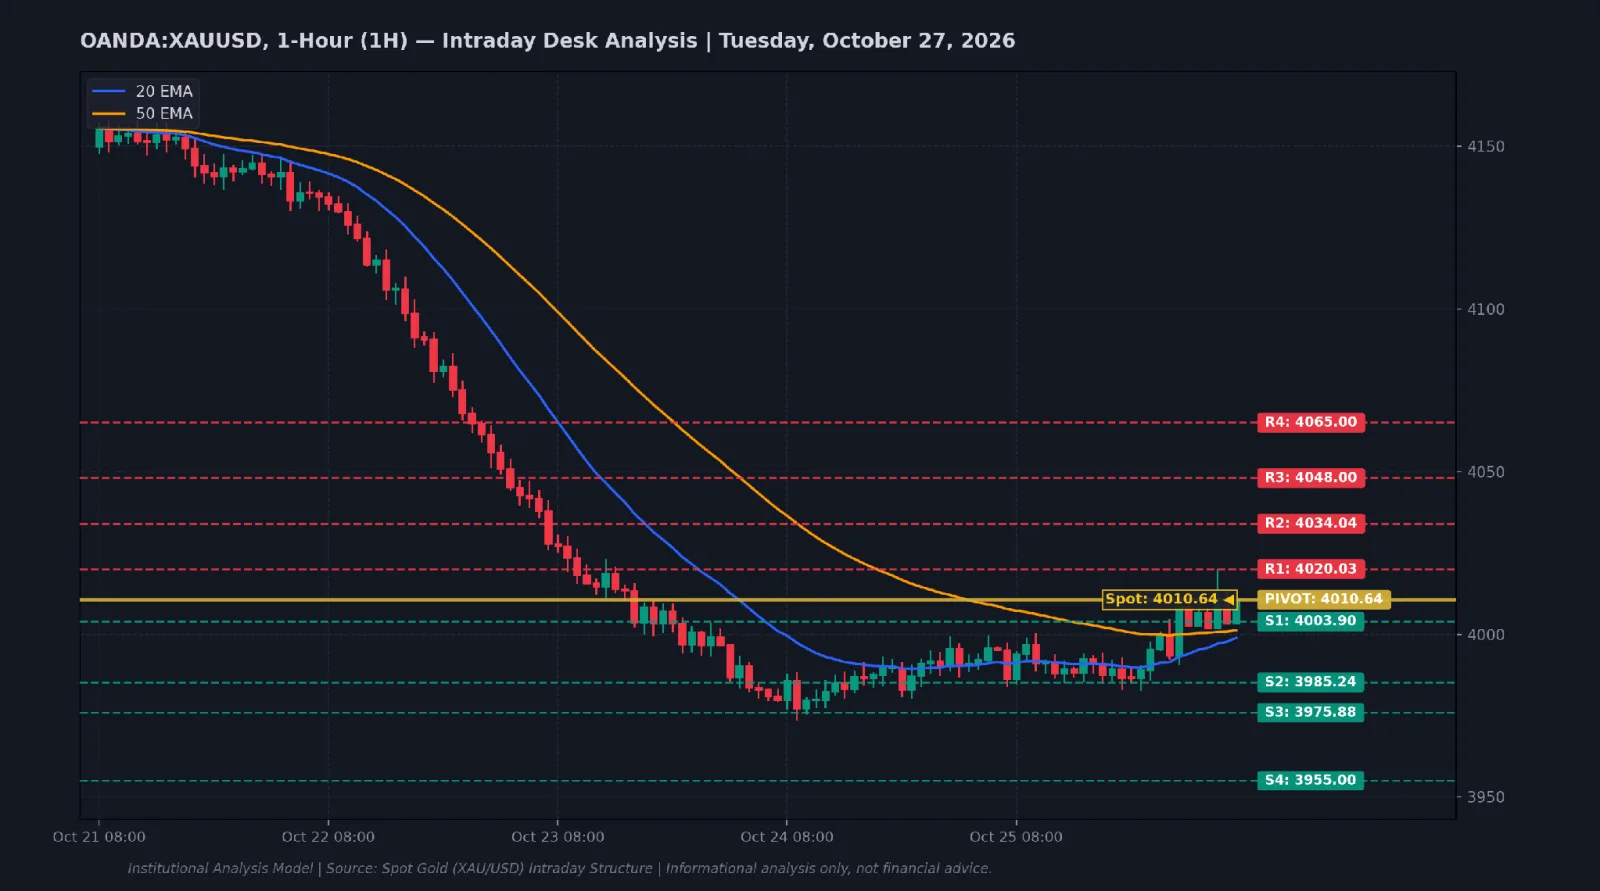
1H Chart: Rebound to $4,020.03 (R1) with complete R4-S4 level mapping and live spot at $4,010.64.
30m
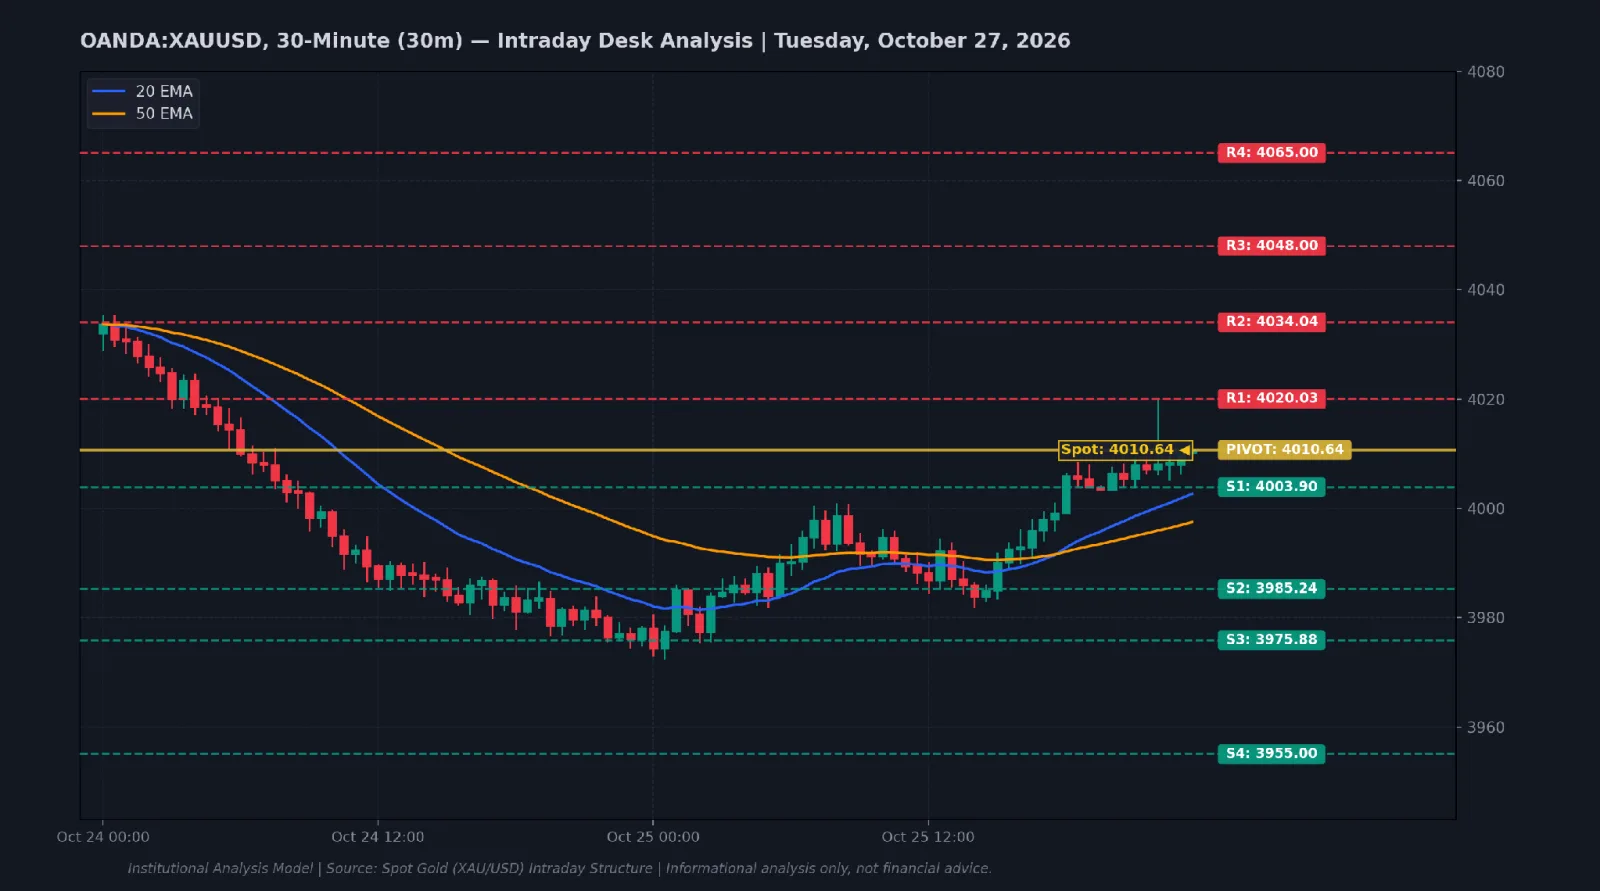
30m Chart: Consolidation above S1 ($4,003.90) with test of overhead EMA resistance.
3. Macro and Geopolitical Analysis
The Federal Open Market Committee begins its two-day policy meeting today, October 27, concluding tomorrow with the interest rate decision and Chair commentary. Markets price a 90.6% probability that the Fed holds rates steady at 3.75% to 4.00%, but money markets remain heavily focused on whether the Fed statement maintains a hawkish bias toward an additional rate increase in December amid sticky 3.7% headline CPI.
The US 10-Year Treasury yield is holding steady at 4.99%, maintaining tight pressure on non-yielding assets just below the 5.00% benchmark. Concurrently, the US Dollar Index (DXY) climbed to 102.02, driven by safe-haven flows and resilient US economic expectations.
Energy markets experienced moderate cooling overnight as diplomatic communications regarding potential maritime de-escalation around the Strait of Hormuz emerged, encouraging profit-taking in crude oil futures. The stabilization in oil prices has temporarily capped immediate headline inflation panic, granting precious metals a modest relief bounce above $4,000.
4. News of the Day and Impact Outcome
Diplomatic optimism in the Middle East coupled with profit-taking in crude oil allowed spot gold to rebound from Monday's $3,978.19 low and reclaim the $4,000 psychological mark, reaching an intraday peak of $4,020.03. However, with the 10-year Treasury yield pinned at 4.99% and DXY advancing to 102.02, institutional desks are treating the move as a corrective bounce within a broader bear flag ahead of tomorrow's Fed announcement.
Upcoming catalysts today (Tuesday, October 27, 2026): 08:00 ET US Building Permits (Sep), consensus -0.20% MoM / 1.40M annualized; 08:15 ET US ADP Employment Change Weekly, previous reading 18.50K; 08:30 ET US Durable Goods Orders (Sep), consensus +1.80% MoM / Core Durable Goods +0.60% MoM; 09:00 ET US FHFA House Price Index (Aug), consensus +0.10% MoM; FOMC Meeting Commences, Day 1 deliberations ahead of Wednesday's policy decision.
Bullish scenario: trigger price, a sustained 30-minute close above $4,020.03 (R1); target, $4,034.04 (R2), with extended short-covering targeting $4,048.00 (R3) and $4,065.00 (R4); catalyst, softer-than-expected US Durable Goods Orders or weak housing metrics that pull the 10-year yield below 4.92%.
Bearish scenario: trigger price, a decisive breakdown and 15-minute close below $4,003.90 (S1); target, $3,985.24 (S2) and $3,975.88 (S3), with extended stop runs challenging $3,955.00 (S4); catalyst, strong US durable goods prints or a 10-year Treasury yield breakout above 5.02% that triggers pre-FOMC risk liquidation.
Informational analysis only, not financial advice.
I'm Aamir Iqbal, a market analyst. I publish the Daily Gold Trading Report, a professional daily XAU/USD report with exact intraday levels, annotated charts, and full macro coverage, at smoothoperator00.substack.com.